

We've added a "Species data profile" panel to every species page which helps you to interpret the records for any species. More...
NatureSpot has over half a million records on its database, covering nearly 8,000 different species recorded in Leicestershire and Rutland (VC55). The new Species Data Profile panel provides some analysis of this data to help us understand the status of each species and how this may be changing over time. Patterns over time are clearer when there are lots of records but some species have been recorded very infrequently.
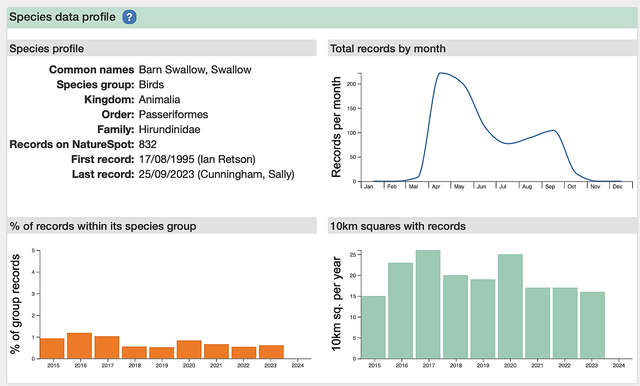
- The Species Profile section shows the first and last records from the NatureSpot database.
- Total Records Per Month is a phenology chart which shows when each species is most commonly observed. (Note that this includes different life stages and not just the adults. Many invertebrates overwinter in places protected from frost and predators but careful searching can also reveal their presence so they may be recorded 'out of season'.)
- Percentage Records Within Its Species Group - more records may simply reflect more recorders but looking at the percentage of records within that species group (e.g. Birds or Beetles) gives us a better guide to relative abundance over time. Note that other factors can also influence how often a species is recorded, such as greater awareness from publicity and improved ID resources. Remember that the last column is the current year so doesn't give an accurate picture until the end of December.
- The 10km Squares With Records chart gives an indication of how widely distributed the species is across VC55 and how this is changing over time. If the bars are increasing in height it suggests that the species is expanding into new areas, and vice versa. Other factors can influence the coverage of records so it isn't an absolute measure, but it gives us a helpful insight.
To try out the new display for yourself, click on any species page on the NatureSpot website, and tell us what you think!